Troubleshoot SOLIDWORKS add-in developed with xCAD framework
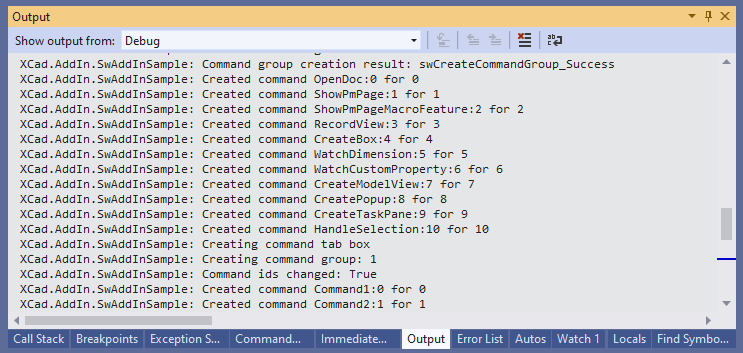
xCAD framework outputs the trace messages which simplifies the troubleshooting process. The messages are output to the default trace listener. Message category is set to XCad.AddIn.[AddIn Name]
If add-in is debugged from Visual studio than the messages are output to Visual studio Output tab as shown below:
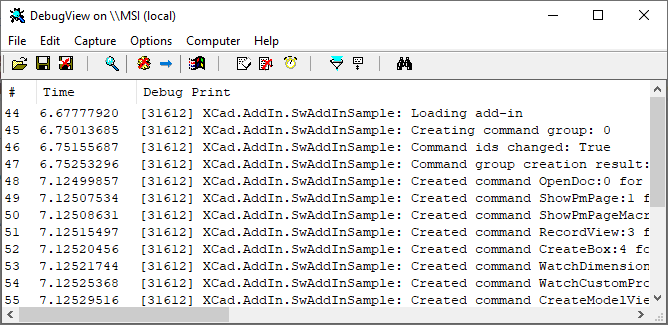
Otherwise messages can be traced via DebugView utility by Microsoft
- Download the utility from the link above
- Unzip the package and run Dbgview.exe
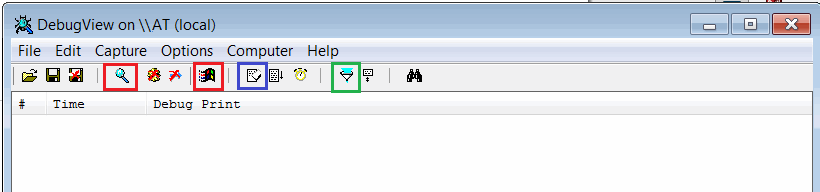
- Set the settings as marked below:
Enable Capture Win32 and Capture Events options from the toolbar (marked in red)
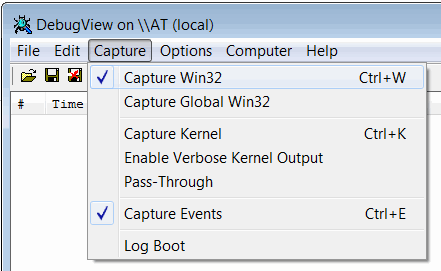
Alternatively set the capture options via menu as shown below:
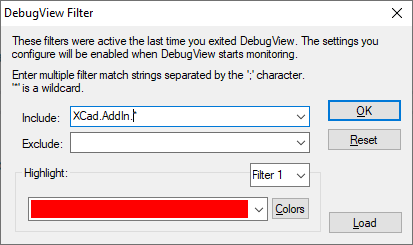
Set the filter to filter xCAD messages by clicking the filter button (marked in green)
Messages will be output to trace window
Use eraser button to clean messages (marked in blue)
Notes
- Trace output is very powerful tool for troubleshooting the add-in on clients computers
- DebugView tool is lightweight and doesn't require installation and is provided by Microsoft
- Trace messages will be also output in the release mode
- xCAD framework will output the exception details if thrown while loading of the add-in which can help solving the problem when add-in cannot be loaded
Custom messages and exceptions can be logged from xCAD module. Log can be accessed from IXExtension::Logger property allowing to log custom messages and exception from the module.
using System;
using System.Runtime.InteropServices;
using Xarial.XCad.Base;
using Xarial.XCad.SolidWorks;

namespace Xarial.XCad.Documentation
{
    [ComVisible(true), Guid("CD7222A3-A70E-421A-8998-46FC184AEDDC")]
    public class LogAddIn : SwAddInEx
    {
        internal const string LOGGER_NAME = "MyAddInLog";

        public override void OnConnect()
        {
            try
            {
                Logger.Log("Loading add-in...");

                //implement connection
            }
            catch (Exception ex)
            {
                Logger.Log(ex, true, Base.Enums.LoggerMessageSeverity_e.Fatal);
                throw;
            }
        }
    }
}
Debugging xCAD.NET Source Code
Starting from version 0.6.0 xCAD.NET supports Source Link allowing to step into original source code directly from the nuget package.
To enable Source Link for xCAD.NET
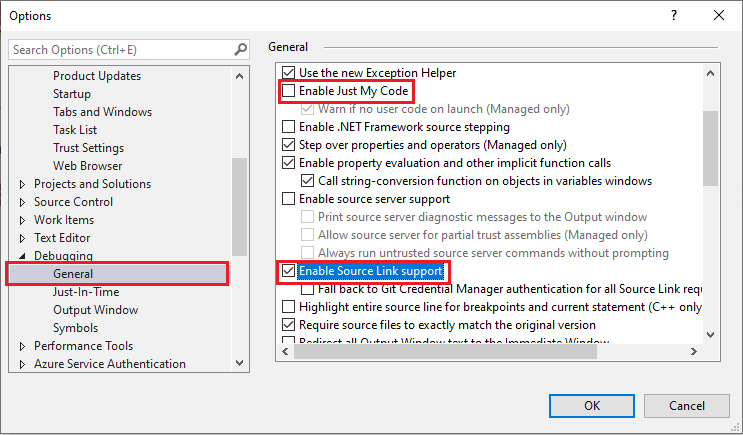
- Set the options in Debugging section of Visual Studio options dialog as below
- Unselect Enable Just My Code option
- Select Enable Source Link support option
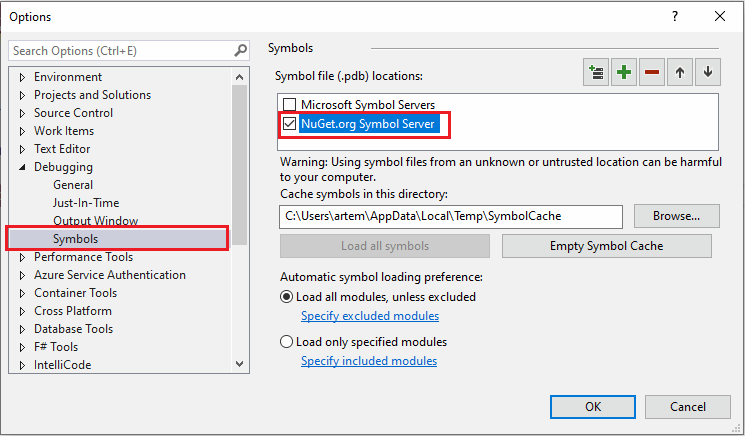
- Select NuGet.org Symbol Server in the Symbols section
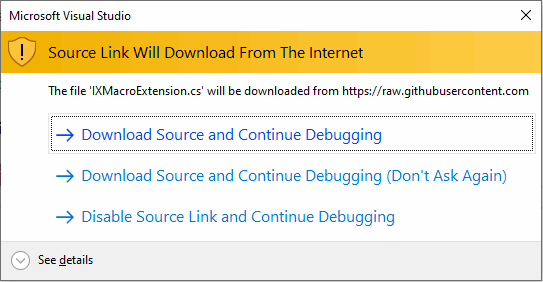
Now it is possible to press F11 or click step into command to debug the source code of xCAD.NET. The following warning will be displayed. Select the appropriate option
Note. It is recommended to disable Source Link when not used
See below the video demonstration of debugging the xCAD.NET source code using Source Link